3D printer lack table
How to build a simple, cheap enclosure for your 3D printer
Maybe you have already seen some of those fancy enclosures people build for their printers. How do they work? And do they work? Today, we will shed some light on this matter! Plus, we are going to dive into patent wars and explain why not all printers come with an enclosure. To top things off, we will even give you a full guide with information on how to build an enclosure for your own printer. But first, let’s start with the fundamental question: what is it good for?
- Stable printing environment – Drafts can negatively impact your print. An enclosure will keep the temperature stable and high. Big differences in ambient and printing temperatures can lead to warping and shrinking of the printed object, especially when printing with ABS. Layer adhesion may also improve with higher ambient temps.
- Reduce and contain smell – Some filaments (looking at you, ABS!) can release unpleasant fumes during printing.
An enclosure will contain these fumes, and you can quickly vent them outside through an open window when the print finishes.
- Noise reduction – As if you needed the MK3 to be any quieter 🙂 But another level of sound isolation can’t hurt, especially if you place the enclosure next to your work desk or in a living room.
- Dust collection – The bearings and smooth rods will appreciate the reduced amount of dust that settles on your printer.
- It’s fun to build 🙂
However, if you’re not printing with ABS or other high-temperature filaments that suffer from warping, you won’t see much of a difference. You might actually want to keep the enclosure open with, for example, PLA to ensure there’s enough cool air around the printer for the part cooling fan.
Enclosure for the MMU2S
If you own the MMU2S, we created a modified version of the enclosure – check it out here.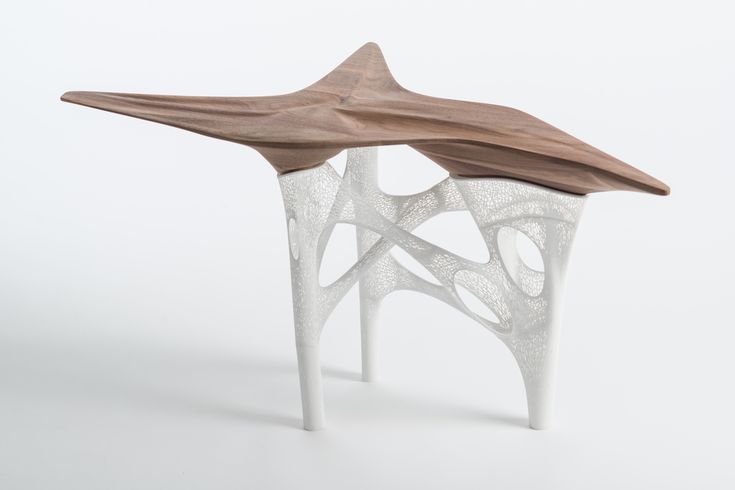
Why aren’t all the printers on the market enclosed by default?
There are two factors here – price and patents. There is no doubt that the rise of consumer 3D printers was delayed by patents. Companies like Stratasys, Zcorp or 3D Systems have patented nearly every 3D printing technology you can think of. It’s pretty crazy when you look at the sketches from 1980s-1990s and realize just how much some of the current 3D printers are similar to them.
It was only after these key patents expired in 2009 (20 years after application) that the RepRap movement started. And cheap, easy-to-build 3D printers quickly started to be developed. Even though most of these basic patents have already expired, some of them (most importantly the ones owned by Stratasys) are either still active, or have just recently expired. For example, Stratasys’s (still active) patent describes an apparatus “That builds up three-dimensional objects in a heated build chamber” (…) “The motion control components of the apparatus are external to and thermally isolated from the build chamber. ” That means if you put the stepper motors outside of an enclosure, you can’t sell the product, as it would violate the patent.
Another obstacle is the price. We have considered and even developed a Prusa enclosure quite a while ago. It was made mostly of Plexiglass. Our target was $90 price tag and considering the packing, shipping and material cost, we just couldn’t make it work. It makes much more sense to build the enclosure yourself from locally sourced materials.
How hot should the enclosure be and can the PSU stay inside?
Let’s get something straight, we are not targeting really high temperatures inside the enclosure. You don’t need an extra heater. The printer itself produces a lot of heat and all you have to do is to not let it escape. The goal is to achieve stable temperatures without any sudden changes from wind or draught. Even just 35°C inside the enclosure will make a massive difference, increase layer adhesion and may prevent ABS from warping.
The PSU is not made to work in extremely hot environments. By keeping the PSU in temperatures above 40-50°C can significantly shorten its lifespan. Ideally, you’d place the PSU outside the enclosure. You can even place the LCD outside to be able to control the printer without letting the hot air out.
2 simple enclosures
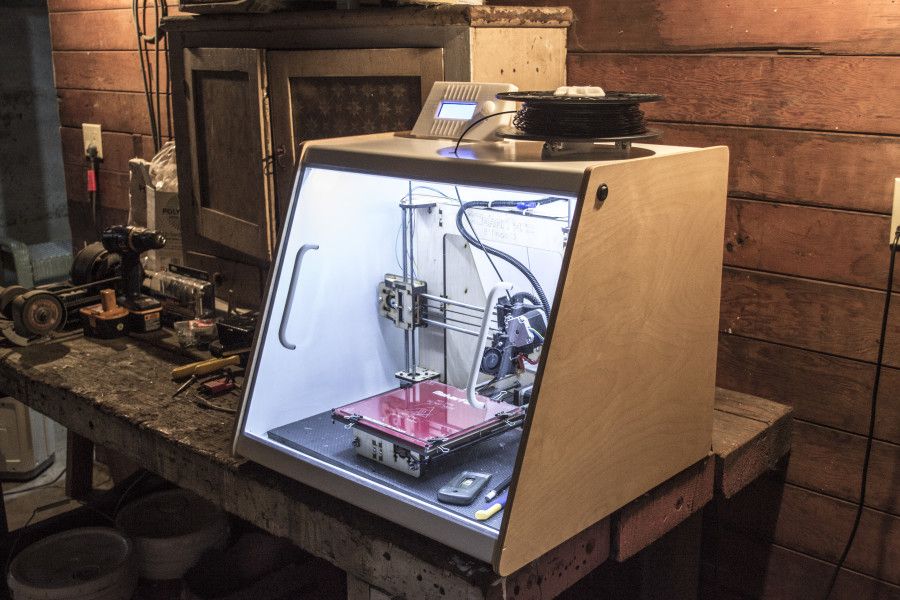
Photo studio tent – no work required at all
An enclosure can often be created from an object originally made for a completely different purpose. This photo (80×80) tent can be bought on eBay or Aliexpress for about $15-20. And all you have to do is place the printer inside the tent. It’s made of textile material, which means it’s porous. A textile enclosure won’t let you reach crazy high temperatures, so you can even keep the PSU inside. We reached temperatures around 38°C after 10 minutes of printing inside a room with the ambient temp. of 26°C – that’s a significant improvement. And as a bonus, you have a photo tent for your prints 🙂
Ikea Lack – when you care about looks as well
Using Ikea Lack as an enclosure is the most popular choice among the 3D printing community. If you search online, you’ll find dozens of Ikea Lack enclosure designs. The table can be bought for under $10 and has almost the perfect size for Prusa printers. You can stack the tables on top of each other to create bays for multiple printers, or use one as filament and tools storage. Even though some of the existing enclosure designs are pretty good, we wanted to give it our own spin.
Advantages of our enclosure
- PSU placed outside in a clip-on holder, but easily placed back if you need to move the printer
- LED lighting connected to the printer’s PSU
- Hinges built into corner extensions
- Double-door opening
- Individual tables can be lifted at any time
What you’ll need
Printable parts
Ikea Lack enclosure main parts
Frame brace replacing the PSU for the MK3 (silver PSU)
Frame brace replacing the PSU for the MK3 (black PSU)
Frame brace replacing the PSU for the MK2/S (remix by Martin Schnur)
60 degree heatbed cable cover for the MK3
45 degree heatbed cable cover for the MK2/S
Construction
- 2x or 3x Ikea LACK table
- 4x Neodymium magnets 20mm x 6mm x 2mm
- 3x Plexi 440 x 440 mm, 3mm thick (if you’re in the US, try Queen City Polymers)
- 2x Plexi 220 x 440 mm, 3mm thick
Electronics
- Fire/smoke detector
- Indoor/Outdoor Thermometer
- LED stripe 24V, 30 cm
- 24V for MK3, 12V for MK2/S
- If you want to use a 12V LED strip with the MK3, use a separate power supply.
- Twin cable, 100 cm
- 2x WAGO 221 or similar compact lever connector
Screws
- 12x 6×20 mm (12 x 3/4″)
- 4x 6×50 mm (12 x 2″)
Printed parts
- Upper table (enclosure box)
- Lower table (support table)
- Spool holders
Tools
- Philips screwdriver
- Allen keys
- Super Glue
- Drill + 3 mm wood drill + 10 mm wood drill
- Measuring tape
- Marker
Enclosure (upper table) assembly
Upper corner standoffs installation
Attaching the legs
LED stripe
For about $12, you can buy an LED strip with a power supply, like this one. However, if you’re feeling a bit adventurous and have some experience with wiring up electronics, you can power the LEDs directly from the printers power supply. Remember, that the MK3 runs on 24V, whereas MK2/S runs on 12V, so make sure you buy the correct LEDs.
Spool holders
Smoke detector installation
Place the smoke detector in the rear part of the table so it will not obstruct filament insertion or won’t get in the way when you’re taking the printer out from the box.
Bottom corner standoffs installation
Before you start screwing the bottom standoffs, make sure you place the Plexiglass in first. As soon as you tighten the standoffs, the Plexiglass will be fixed in place, and you won’t be able to remove it. This means you can easily lift this section of the enclosure without worrying that the glass would fall out. Note, that one of the four standoffs has a hole for cable pass-through. Make sure you place this standoff on the left side so that the cables can be routed directly to the EINSY board.
Support table (lower table) assembly
PSU holder
Electronics do not thrive in higher temperatures inside the enclosure.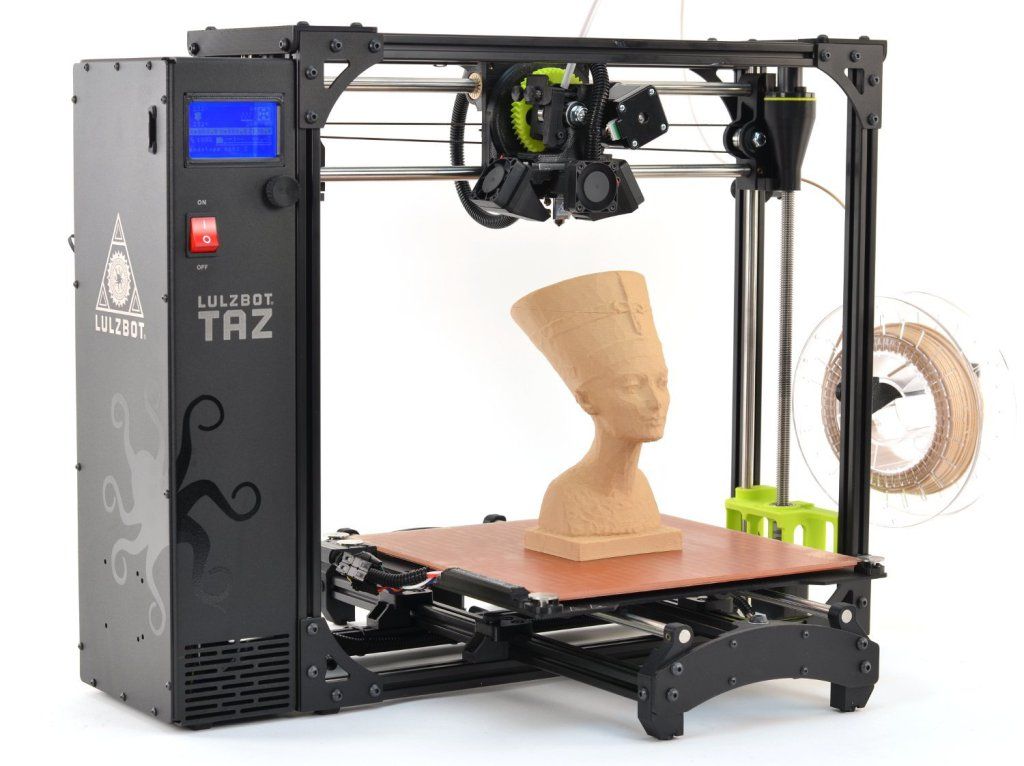 To preserve PSU in good condition, it’s better to place it out of the box. It is even safer!
- Unplug the printer from the power socket. Remove zip ties on the frame to release PSU cables. (Tighten the rest of the cables with new zip ties.)
- Disconnect the cables from the EINSY board. Do not forget to unplug the Power panic sensor as well.
- Unscrew the PSU form the frame.
- Hold the PSU next to the rear left leg (the one with the cable pass-through). Tighten the PSU holder printed part with two screws and then install PSU catcher printed part.
- PSU is now fixed, but it is possible to slide it out when you need it.
- You can replace the PSU on the frame with this printed part to ensure the rigidity of the frame.
Frame brace and right-angle cable cover
After removing the power supply from the frame, it’s possible to replace it with a printed part and ensure frame stiffness. The heatbed cables may hit the plexiglass in the back of the enclosure. To prevent this from happening, print an alternative 60 degree heatbed cable cover. (EDIT: Users reported several problems with the right angle one shown in the video and on the pictures below, so we switched the suggestion to the 60 degree one).
Plugs fixing and magnetic handles
Fix the four bottom plugs. One of them has a hole for cable pass-through. Place it in the rear left corner of the enclosure. Glue two magnets to the door stopper and screw it to the front of the table. Leave enough space for the plexiglass and the handles (1 cm).
Finished enclosure
Now just stack the two tables on top of each other and the enclosure is complete. Optionally, you can add another Ikea Lack table to the bottom to raise the printer to a more comfortable height.
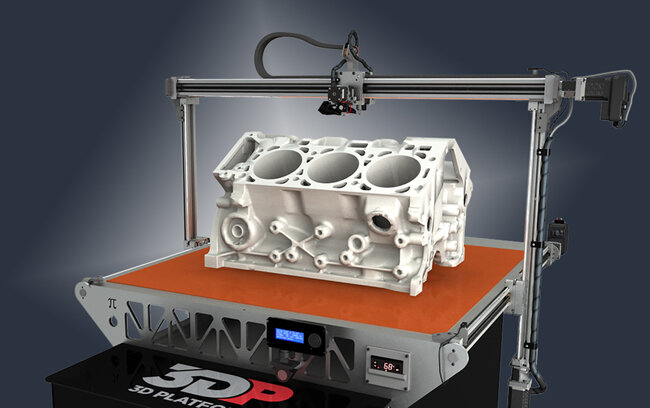
3D Printer Enclosure for Ikea LACK Tables: Works With Most FDM
This is the perfect way to build up a fancy-looking enclosure for your 3D Printer without hassling with all of the parts. You can select as many or as few parts as you need in order to build your Ikea LACK enclosure. This way, you can save time and money while receiving high-quality, PETG prints in the color that matches your style.
***This enclosure does NOT fit the Creality Ender 3 V2 printers (and similar). If you have the Ender 3 V2 or a printer of similar size, please select the link to our other listing below which is resized to fit these printers:
https://www.etsy.com/listing/1327146072/resized-3d-printer-enclosure-for-ikea
The base kit comes with the least amount of parts, consisting of only the 3D Printed parts you would need for putting together 2 Ikea LACK tables. The upgraded kit features a number of addons together for a discounted price. Then lastly, the upgraded kit with plexiglass includes all of the previous items and adds a set of five plexiglass sheets, two of which make up a door to make opening up the enclosure for accessing your printer a lot easier. **NOTE: The plexiglass will be shipped according to your home address from a separate company. It will come as a separate package with no extra charge.**
There is also an additional parts option. This option is recommended to be purchased along with any of the kits that come with the enclosure. The contents of the additional parts are listed below. The filament spool holders come with screws on them so they can be mounted to the top of the Ikea LACK table. The filament guides require a hole to be drilled through the table so the filament can go into the enclosure without being scratched or chipped. The tap light is a basic light that can be mounted to the inside of the enclosure (adhesive pads included), making it easy to work with your printer inside the enclosure. The thermometer has a plastic stand and can be placed inside the enclosure. It has a highly accurate gauge that measures temperature and humidity. Note that the light and thermometer do not come with batteries. The additional parts will make your enclosure look and feel complete and have many incredibly helpful benefits.
There are a couple of helpful videos that you should consider checking before you buy it and during the build:
Chris Riley's Video:
https://www.youtube.com/watch?v=laTXCyLQIYs&list=WL&index=47&t=2s
Prusa Printers' Video:
https://www.youtube.com/watch?v=oS7ZtBNh3hE
Please contact us with any questions, comments, or concerns and we will try our best to answer them as quickly as possible. You can also contact us to have specific parts in different colors to match your dream setup.
Base Kit:
- Top Table Leg Connecters (With 3mm Plexiglass Slots) - x4
- Top Table Connector Door Hinges (For The 3mm Plexiglass) - x2
- Bottom Table Leg Connecters (With 3mm Plexiglass Slots & Table Stacker Slot) - x4
- Table Stackers - x4
- Door Knobs (With 3mm Plexiglass Slots & Magnet Inserts) - x2
- Door Holder & Stopper (With Magnet Inserts) - x1
Upgraded Kit:
- Base Kit - x1
- 1-Inch Screws - x20
- 3/8-Inch Screws (For Door Holder & Stopper) - x3
- 20mm x 6mm x 2mm Magnets (For Magnetic Door Set) - x4
Free Optional Add-ons: (COMMENT IN PERSONALIZATION IF NEEDED)
- Prusa PSU Holder - x1
Contains: PSU Holder - x1, Upper Bracket - x1
- Table Stackers & Couplers - x1 (Only if you are using 3 Ikea LACK Tables)
Contains: Bottom Table Leg Connectors (With No Plexiglass Slots) - x4, Bottom Table Stackers - x4
Upgraded Kit With Plexiglass:
- Upgraded Kit - x1
- 440mm x 440mm x 3mm Plexiglass (Sides & Back of the Enclosure) - x3
- 440mm x 220mm x 3mm Plexiglass (Front Side Doors) - x2
Additional Parts:
- Filament Spool Holders - x3
- Filament Guides - x3
- Tap Light - x1
- Digital Indoor Thermometer - x1
Instructions for setting up all the mechanics of a 3D printer: from belts to speeds
The quality of the printed models directly depends on the mechanics of the printer, namely on its correct settings.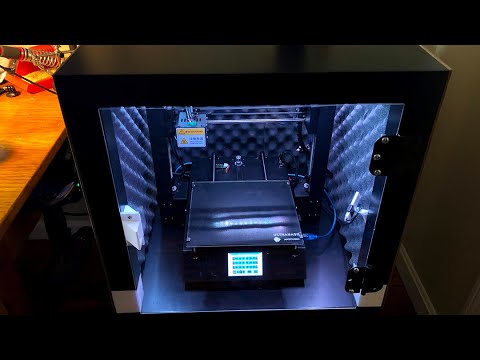 Any elements of the printer wear out over time, so the printer must be set up at least once every 5-6 kg of printed filament. With the help of the short instructions described in this guide, you can quickly and easily set up the mechanics of your printer: belt tension, motor current, motor steps, acceleration, jerk and speed. nine0003
Mechanics includes
3D printers of any design always contain the same things: Axes and rails along which the elements of the printer move and motors with belts that set these elements in motion. In a classic printer design, there are at least 3 motors (one for each axis), 3 rails (one for each axis) and an electronics board that controls the motors. The latter can hardly be called part of the mechanics, but since it controls the engines, it also indirectly affects the quality of the model. nine0007
Printing defects due to mechanical problems
Before changing anything in the printer, you need to decide what exactly needs to be configured.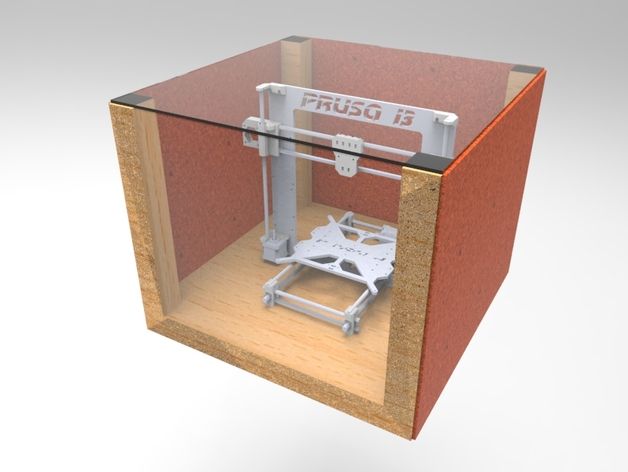 Often defects are visible visually. Our blog has an article about most printing defects, which details the reasons for their occurrence. The following is a list of defects and what element of mechanics they are associated with:
-
Layer shifting - Belts, Motor current, Guides
nine0017 -
Ringing - Guides, Speed
-
Incorrect model geometry - Guides, Motor steps, belts
As you can see, all the above problems do not interfere with the printing process itself, but the result leaves much to be desired. Sometimes mechanical errors can completely stop the printer from working. Therefore, it is better not to take the situation to extremes and, if any problems arise, immediately start checking and configuring the 3D printer. nine0003
How to save settings
To fix some defects, you need to change the printer software settings. Therefore, before adjusting the mechanics, it is necessary to understand how to properly store the settings inside the printer.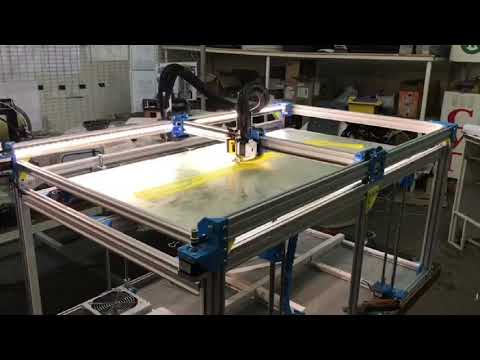 There are 3 ways to do this:
All settings are located in the corresponding menu of the printer
Depending on your firmware, this manual will indicate code sections for MARLIN firmware in the configuration.h file nine0003
We first enter the parameters into the printer and then store them in EEPROM - the internal memory of the microcontroller. Or paste all the necessary settings at the beginning of GCODE. To learn how to do this, read our article on working with GCODE and creating macros.
To save to EEPROM, you need to send the printer a command to change some value (which can also be inserted into the initial GCODE), and then send the M500 command (save the current settings to permanent memory). The EEPROM function must be enabled in the firmware, for this you need to remove two slashes in the line: nine0003
//#define EEPROM_SETTINGS
Whichever option you choose, you should be careful when using any commands. You will not be able to harm the printer in any way when changing the settings, but if you make a mistake, you will have to look for the cause of possible further problems for a long time.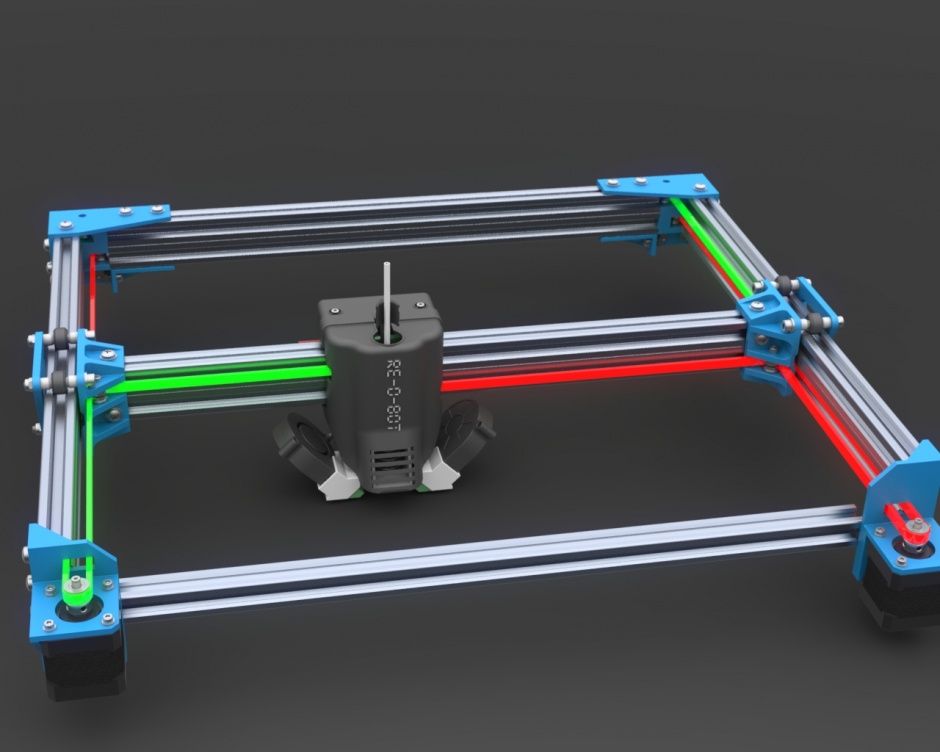
Setup instructions
Now you can start setting up the printer itself. If you decide to set several parameters at once, then it is better to use the order of adjustments as in the article, since some of the settings are related to each other and if you use the wrong order, adjusting one element of the mechanics will override the settings of another element. For example, you should not adjust the motor steps before tightening the belts, as changing the length of the belts will change the "true" steps per millimeter of the motors. Also, before setting up, you must make sure that there are no backlashes in the printer frame, tighten all belts. nine0003
Belts
The first thing to start setting up the printer is the belts. They directly affect the geometry of the model and, when pulled too much, they cause a lot of problems: displacement of layers, changes in geometry, ripples. First you need to make sure the belt is intact. To do this, look at the entire belt, especially the areas where the belts bend. If the belt has outlived its usefulness, then you can see a section of the belt where the distance between the teeth has greatly increased and a metal wire (cord) is visible between them. This means that it's time to completely change the belt. nine0003
Broken belt with broken cords
If the belt is intact or you have already replaced it, then you can proceed to the next step. Depending on the design of your printer, you need to move the roller through which the belt passes. The tension should be such that the carriage or table moves effortlessly, but at the same time, when moving quickly, the belt should not slip the teeth on the motor gear. Adjust the tension of the belts on each axis of the printer using this method. nine0003
Tip: if your printer came with a belt tensioner in the form of a spring attached to the belt itself, remove it. Due to the flexibility of this tensioner, printing defects will occur, such as protruding corners on the model.
It is better to adjust the belt without using this tensioner.
Belt tensioner
Current motors
As we know from the school physics course, the power of the engine depends on the voltage and current strength. Since the voltage on all printer electronics is the same everywhere, the only thing that can be changed is the current on the motor. More precisely, it should be said the maximum current that the driver will supply to the motors. To change this limit, you need to climb inside the case and find the printer board. On it you will see the printer driver. We are interested in a small potentiometer on the driver itself (in the picture below it is indicated as a tuning resistor). nine0003
Potentiometer location example on driver
For adjustment, you will need a voltmeter and a small Phillips or flathead screwdriver. Before proceeding further, it is necessary to calculate the maximum current supplied to the motors. Different formulas are used for different drivers, the most popular ones will be listed in the table below:
| Driver name nine0003 | Formula | Explanations |
| A4988 | Vref = Imax * 1.25 for R100 | To understand which formula to use, you need to find a resistor with the signature R100 or R050 on the driver. They are located next to the driver chip. nine0003 |
| DRV8825 | Vref = Imax / 2 | |
| LV8729 | Vref = Imax / 2 | |
| TMC2208 nine0002 TMC2100TMC2130 | Vref = Imax * 1.41 | One formula for all drivers |
The value of the maximum current (Imax) depends on the motor controlled by the driver. This can be found in the engine specification or on the sticker on it. The following are the currents for the most popular motor models: nine0003
17HS4401 - current 1.7 A
17HS8401 - current 1.8 A
17HS4402 - current 1.3 A
Substituting the value into the formula, we get the Vref value for the maximum current supplied to the motor. But at this value, the engine will get very hot, so the resulting Vref value must be multiplied by 0.7. For example, for a motor with a maximum current of 1.5 A and a TMC 2208 driver:
Vref=1.5*1.41*0.7=1.48V nine0003
Now the resulting value can be used when configuring on the printer itself. To do this, disconnect the wires going to the motors, turn on the printer and place one voltmeter probe in the center of the trimmer, and the second probe to the negative terminal on the power supply (you can also use the negative terminal on the printer board and the contact on the driver, labeled as GND).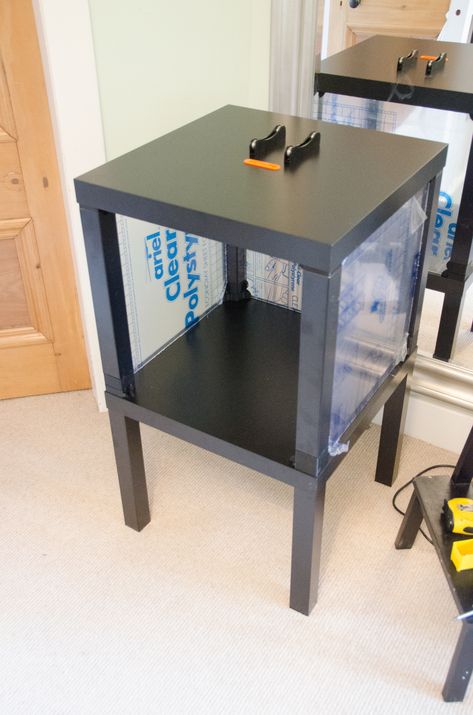 You will see some value on the voltmeter screen. Turn the trimmer clockwise to decrease the Vref value and counterclockwise to increase it. nine0003
Attention: you should not specify a Vref value higher than the maximum calculated for your engine! Otherwise, the engine will soon break down!
Once you have adjusted the value on the drivers, you can turn off the power to the printer, connect the motor wires, and put the case back together. This completes the driver setup.
Motor steps
When setting up motor steps, you will need a ruler. For convenience, you can use the program Repetier-Host. The adjustment for each of the three axes occurs according to the same algorithm: nine0003
-
Set the caret to zero coordinates (Autohome or G28)
-
Move the carriage some distance
-
We measure how far the carriage has traveled
-
We calculate the correct number of steps per millimeter using the formula:
True steps per millimeter = current steps per millimeter * reported distance / distance traveled nine0003
For example, if the printer was set to 100 steps/mm, we tell the printer to move 80mm and the printer travels 87. 5mm. Then the correct steps per millimeter would be 100 * 80 / 87.5 = 91.42 steps/mm. For the convenience of measurements, you can fix a ruler on the table, and a thin object, such as a needle or pin, on the carriage. Then it will be possible to accurately measure the distance traveled. The extruder uses a partially different algorithm to measure distance: nine0003
-
Inserting plastic into the extruder
-
Cut it right at the outlet
-
We give the printer a command to stretch the plastic a certain distance (at least 100 millimeters)
-
Cutting plastic again
-
We measure the length of the resulting piece of plastic nine0003
-
We use the formula from the previous algorithm
Next, the settings data must be inserted into the firmware in the line:
#define DEFAULT_AXIS_STEPS_PER_UNIT {X,Y,Z,E0}
X,Y,Z and E0 should be replaced by the steps per millimeter for each of the axes, respectively. Otherwise, you need to insert this line into the initial GCODE:
M92 Ennn Xnnn Ynnn Znnn
Instead of nnn in each of the parameters, you must substitute the steps per millimeter for each axis. If you want to adjust the steps only for not all axes, then you can remove unnecessary parameters.
Acceleration
This parameter is responsible for the rate of change of speed. That is, how fast the printer will change its speed. This affects the nature of the movement of the hot end relative to the table. If the acceleration is too small, then the printer will print slowly, if it is too large, then the outer surface of the model will have visual defects: fading waves will be visible near each of the corners, as in the picture below. nine0003
To set up acceleration, you need to follow simple steps:
-
Cut a model of a standard test cube with a wall thickness equal to one nozzle diameter, without filling and top layers, bottom 2-3 layers;
-
Open GCODE file in notepad;
-
Find the G28 command at the very beginning and insert the line data after it: nine0003
M201 X5000 Y5000
M204 P500 T500
-
Save the changes, print the model according to the received GCODE and note at what parameters P and T it was printed;
-
Open the same GCODE file and change the P and T values on the second line, adding 500 to each;
-
Repeat steps 4-5 at least 3 times; nine0003
As a result, you will get several test cubes, some of which will show waves at the corners. Choose the cube that is printed with the highest P and T parameters, but that no waves can be seen on it. The number in parameter P will be the desired acceleration value. To save this value, you need to find 2 lines in the firmware:
#define DEFAULT_MAX_ACCELERATION {X,Y,Z,E0}
#define DEFAULT_ACCELERATION {nnn} nine0003
Instead of X and Y, you should put an acceleration twice as high as found earlier. And instead of nnn, you need to put the acceleration value found earlier. Otherwise, you need to insert a line in the initial GCODE:
M204 Pnnn Tnnn
In the parameters P and T, you need to put the value of the found acceleration. After that, the acceleration setting can be considered complete.
Jerk
A jerk indicates the speed with which to start accelerating. It affects the model in a similar way as acceleration: it creates ripples around the corners of the model. But it also increases the protrusion of the corners if the jerk is too small. The jerk setting is also similar to the acceleration setting: nine0003
-
Cut a model of a standard test cube with a wall thickness equal to one nozzle diameter, without filling and top layers, bottom 2-3 layers.
-
Open GCODE file in notepad
-
Find the G28 command at the very beginning and insert the line data after it:
M205 X5 Y5
- nine0002 Save the changes, print the model according to the received GCODE and note at what X and Y parameters it was printed
-
Open the same GCODE file and change the X and Y values on the second line, adding 2 to each
-
Repeat steps 4-5 at least 3 times
As a result, you will get several cubes. Find a non-rippled cube printed at the highest X and Y settings. This will be the jerk value for your printer. To save them, you need to find the line in the firmware: nine0003
#define DEFAULT_XJERKnnn
#define DEFAULT_YJERKnnn
It is necessary to substitute the jerk values for the X and Y axes, respectively.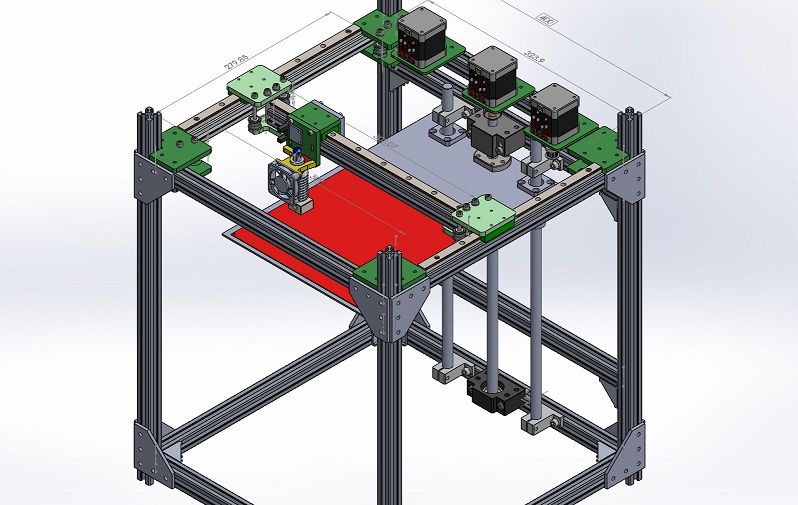 Otherwise, you need to substitute the command in the starting GCODE:
M205
Instead of nnn, you need to substitute the jerk value found earlier. This completes the jerk setting.
Speed
In fact, there are many different speed parameters, the values \u200b\u200bof which vary greatly. Let's take a look at the main ones: nine0003
This parameter is responsible for moving the nozzle without extruding plastic. The value is in the range from 80 to 120 mm/s. Limited only by the maximum speed at which the motors can rotate. Does not affect the model
This speed is important because it indirectly affects the adhesion of the model to the table. Usually lies between 15 and 30 mm/s
-Print speed of inner walls
Usually set to about 60 mm/s, it only affects the strength of the model. Depends on the maximum amount of plastic that the extruder can push through the nozzle nine0003
-Speed of printing outer walls
Usually about half the printing speed of the inner walls (30 mm / s). It affects not only the strength of the model, but also the appearance: the lower this speed, the smoother the walls will be.
The standard value is 80 mm/s, it only affects the strength of the model
Usually set from 20 to 40 mm/s, the quality of the upper layer of the model depends on it: the lower the value, the smoother the cover. nine0003
All of the above parameters are selected experimentally. Usually there is a simple rule: higher speed - lower quality. Therefore, do not try to find the ideal value for all situations. It is better to find values for fast printing, quality printing, and an average that will be used for most models.
Check settings
The last step in setting any of the above parameters will be to check the result. If you have written parameters in firmware or saved them in EEPROM, you can use the M503 command. It will display all printer settings on the computer. To test the settings in practice, you can print several test models: nine0003
Classic Benchy
Simple calibration cube
Calibration cat
On each of the above models, defects will be clearly visible, if they still remain after the mechanics are adjusted.
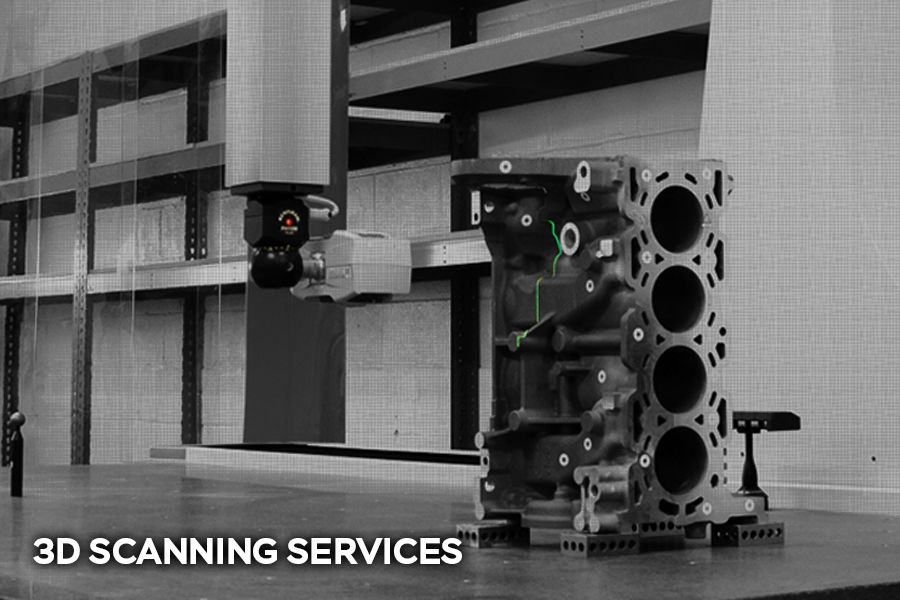
Fine dust and VOC emitted by 3D printers when printing with various filaments (translation) / Sudo Null IT News0001
Dear members of the forum, I welcome you again! In the previous translation [1], the bias was made primarily on the data on fine dust emissions when printing with ABS and PLA plastics. This article presents more complete material on research led by the same University of Illinois professor Brent Steffens [2] on the release of fine dust and a whole range of volatile organic substances (VOCs) in the 3D printing process with an expanded range of used types of filament (nine pieces instead of two specified), as well as a range of models of 3D printers (five instead of two). The translation of this article is published with the consent of the author. Thank you for your attention and feedback! nine0003
Abstract
Previous studies have shown that 3D printers can release significant amounts of fine dust (particles less than 100 nm) as well as some potentially harmful volatile organic compounds (VOCs) during the printing process, and a small amount of circle of filaments and 3D printers. In this article, we determined the composition of fine dust emissions and a small range of volatile compounds when printing with five different affordable 3D printers, using up to nine different types of filament in a hermetically sealed fume hood. The average values of fine dust emission rates were in the range from ~10 8 to ~10 11 h/min (ppm) using all possible combinations of 3D printer model and filament used, and platen temperatures (had the least impact). The analysis showed that among the VOCs released in the highest concentrations, there are gases such as caprolactam when printing with nylon, as well as plastics that imitate wood and brick (in the range of 2-180 μg / min.), Styrene - ABS and high-impact polystyrene ( 10-110 µg/min.), and finally lactide-PLA plastic (4-5 µg/min.). The results of the analysis of the most concentrated substances in a small office indicate a potential hazard to human health when printing with various plastics in poorly ventilated or not equipped with filtration systems.
 nine0003
1. Introduction
Nowadays, 3D printers (three-axis printers) are rapidly gaining popularity. This is facilitated by a widely developed sector of low-cost models, mainly designed for the average consumer. The workflow of these additive devices using thermoplastic extrusion with plastics is as follows: an initially hard filament is pushed through a heated extruder, melted and laid in thin layers on an axially moving table. A solid 3D printed model is formed layer by layer as the heated plastic cools and solidifies. It is known that printing in this case can be done with a fairly wide range of filament types: ABS (acrylic-butadiene-styrene), PLA (polylactide resin), PVA (polyvinyl), PC (polycarbonate), hard-pressed PE (HDPE), high-impact PS ( high-impact polystyrene, HIPS), nylon and many other polymers, metals, ceramic mixtures, etc. Depending on the selected filament, the printing temperature of the extruder and the printing table varies, in addition, the choice of the optimal temperature (recommended temperature range) for printing is influenced by recommendations for operation of 3D printer manufacturers when printing with specific materials and the diameter of the print nozzle.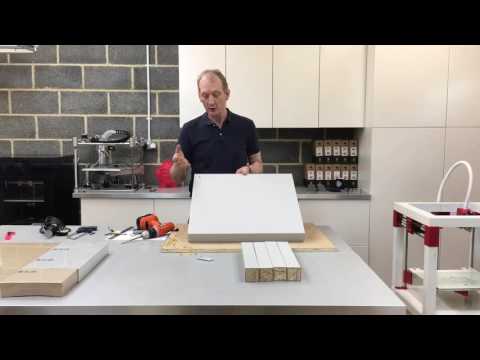 Among all plastics, ABS and PLA are considered the most used in printing, other plastics are slightly less popular. nine0003
It is now well known that thermoplastic extrusion of plastics emits both fine dust and gases. However, there is no information about the scale and chemical composition of these precipitates, as well as how their character changes depending on the selected type of filament and 3D printer model. In 2013, we published data on fine dust (particles less than 100 microns in diameter) produced during the printing process of ABS and PLA plastics. These measurements played a major role in the further study of the possible toxic effects of 3D printing volatile products, for example, the poisoning effect of emissions from thermoplastic extrusion in animal experiments was shown, and other sources reported the detrimental effect of emissions from 3D printing on human performance. organs. So far, we are familiar with only one study published by scientists Kim and others, also devoted to the analysis of the composition of fine dust emissions and total concentrations of volatile substances: aldehydes, phthalates, benzene, toluene, ethylbenzene and P-xylene vapors during 3D printing by two closed ABS printers and PLA filaments.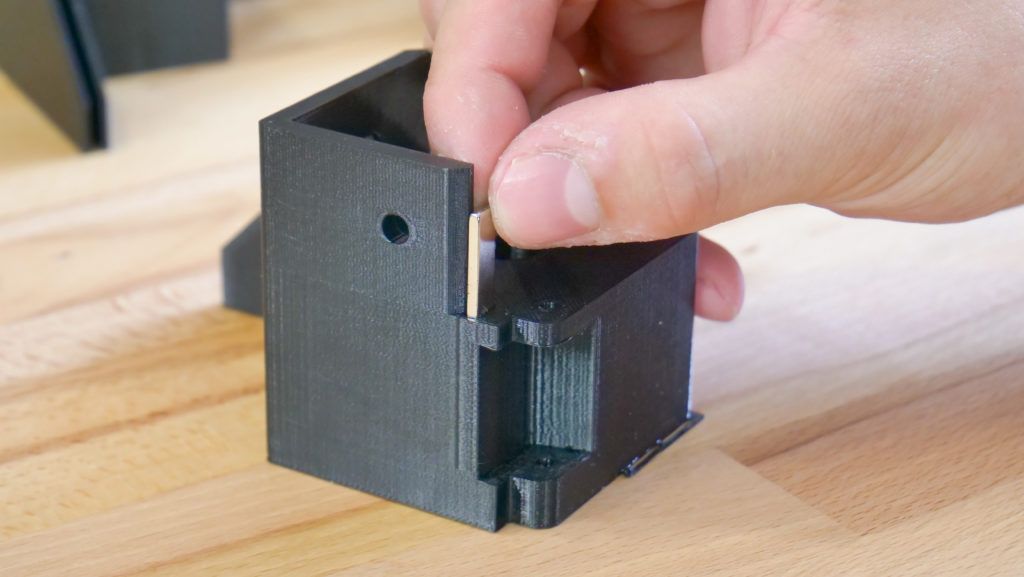 The results of this study confirmed twice the emission of fine dust and VOC when printing with the first plastic compared to the second. nine0003
To date, with the exception of data published in these two studies, the known data on the issue of emissions during the printing process is limited. It should be added to this that only a narrow range of 3D printers and types of filaments was analyzed for fine dust and VOC emissions (i.e., only ABS and PLA). Moreover, it is possible that the authors of the research by Kim and others missed some of the volatile compounds released during the 3D printing process, since the group of scientists focused on fixing only substances already known and available for study with a gas mass spectrometer. In addition, we do not have information about the characteristics of the used filaments, as well as the design features of 3D printers (for example, the presence of outlet holes in the design that contributed to the release of volatile substances from the working area to the outside). nine0003
Therefore, in this article we will try to complement the research of the group of Kim and others, expanding the range of investigated substances released during the printing process and the range of printers used to five instead of two, choosing the most popular models of 3D printers today and using up to nine different types filaments when printing standard test patterns in a medium sized fume hood. Based on the data obtained, we also compared the data on the release of fine dust and VOCs depending on the type of filament used and the characteristics of the 3D printer model, as well as the effect of the geometry of the printed object on the concentration of emitted substances. nine0003
2. Experimental methods
2.1. Excretion fixation methods
All measurements were taken inside a 3.6 m 3 stainless steel fume hood with a small metal fan (illustrated in the supporting instructions (Figure S1). All 3D printers were connected to a desktop computer outside the cabinet. Before testing experiment, the fume hood was pre-equipped with an air filtration unit with a variable operating mode of one hour for eight hours until complete air purification - the starting point of the research.Print tables were also pre-treated with isopropyl alcohol, and if necessary, depending on the model used, 3D- printer and filament type and other adhesives to prepare the print bed for the printing process in accordance with the recommendations of the manufacturers, after which printing of a small model was started.0003
During all stages of the study, except for one, a model was printed, taken from the resource base of the National Institute of Standards and Technology (NISIT), with dimensions of 10×10×1 cm (shown in Figure 1). This model is specially designed for testing and evaluating existing additive technologies, in addition, it has a number of features that allow you to capture dynamic changes in selections during 3D printing due to the complexity of the geometry: thin protrusions, holes and depressions.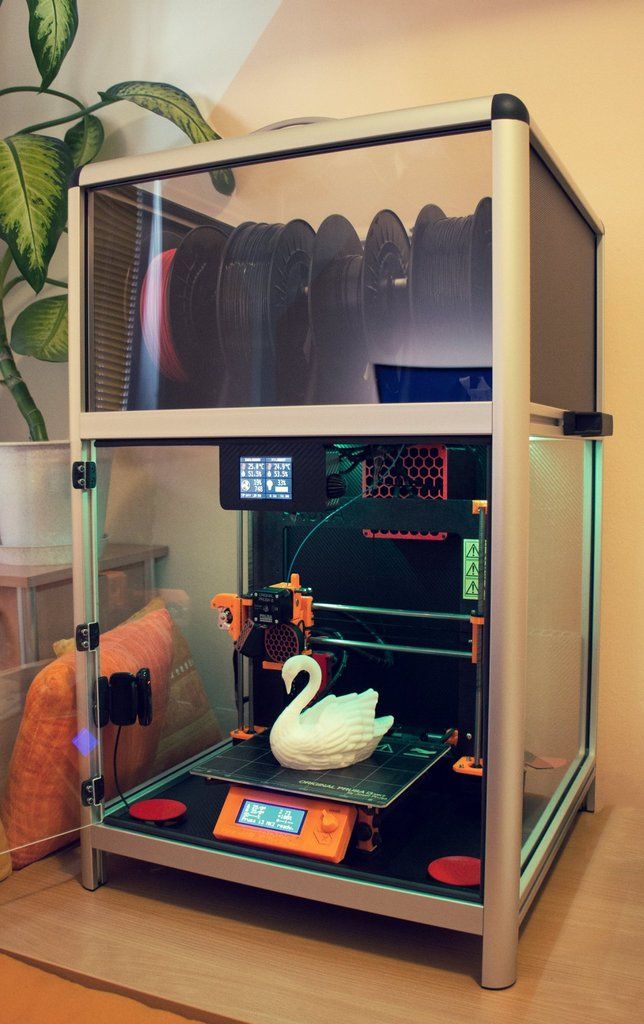 Also, we repeated the test with the printer when printing with a combination of filaments, printing a cube of size 195 cm 3 , which practically does not differ from the original from the same NISiT resources (taking into account that the geometry of the printed part significantly affects the nature of emissions). The heating period of the nozzle and the print bed took an average of 5-10 minutes depending on the printer model and the filament used, the printing time varied from 2.5 to 4 hours with the variation of the used additive devices, filaments and 3D printed models.
2.2. Air Sample Analysis
Fine dust concentration data was obtained using the TSI Model 3007 Condensing Particle Counter with 1-minute trigger intervals inside the hood side of the laboratory hood. The particle counter was installed inside an exhaust hose 0.9 m long and 0.6 cm in diameter. This dust counter is capable of measuring total particle concentrations in the range of 0. 01-1 µm with an upper limit of particle counting capability of 105 ppm 3 and a maximum flow of 0.7 l/min. Measurements were carried out during all stages of the study, starting with the last 45-60 minutes of background concentrations, then 2.5-4 hours of printing models (including the warm-up time of 5-10 minutes of the nozzle and printing table) and the final 3 hours, when dispersion of air compounds until the return to the previous level of background concentrations.
To reiterate, the particle measurement range of the TSI 3007 dust counter is from 0.01 µm to 1 µm, in the same range is the vast majority of detected particles (as shown in the preliminary data section in the Reference Material (Figure S4). Therefore, it can be said with confidence that the obtained data reliably reflect the total concentrations of fine dust, they were later used in the calculation of concentrations.We periodically calibrated the dust counter inside the laboratory cabinet by conducting joint measurements with a dust meter that scans the dynamics of particle sizes, TSI Model 3910 which has been adjusted by the factory manufacturer. We had no doubts about the accuracy of the last device, but it was not possible to use it throughout all stages. Therefore, it was necessary to resort to the calibration of the dust meter through regression with polynomial coefficients, using data from these few stages of joint measurement by both devices. The synchronism of obtaining data on the total number and concentrations of particles for a long time was almost not disturbed in the range of recommended throughput values, taking into account the manufacturer's recommendations (up to 105 h/cm 3 ), but subsequently decreased exponentially for particles larger than the size range of ultrafine dust, which is typical for such equipment. This had to be taken into account due to several large spikes in total concentrations exceeding the 105 h/cm capacity of 3 in a fume hood.
Air sampling was also carried out inside the cabinet and during VWO analysis using Tenax-GR sorbent tubes over two periods: the first ~45 minutes before printing (i. e. with the printer turned off in the chemistry cabinet) and the second during the same length of printing time until the equilibrium state of the air is established. We used the concentration difference between these two steps to record values for the ten most concentrated gases individually and collectively with the TSI-Q-Trak Model 7575 Air Quality Monitor coupled with a Model 9 Photoionizing Sample Detector.82. This was necessary for several reasons: firstly, to ensure that the mass balance equation for the total concentrations of VOCs during air sampling was valid, secondly, to ensure that the gas mixture had reached equilibrium after two hours from the start of printing, and finally that the function of total allocations has the form of a constant (reflected in Figure S3). Therefore, we consider the process of taking air samples for subsequent BWO analysis in the last ~45 minutes of printing of each object as reasonable for the equilibrium state. nine0003
The technology for sampling and analysis of adsorbent tubes used in these studies, with some modifications, is based on the TO-17 method developed by the US Environmental Protection Agency. The adsorbent tubes were placed in the small outlet of a fume hood, connected to a low power Buck VSS-1 air pump at an operating speed of ~20 ml/min. Air flow rates were measured at the end of each study period using the Gilian Gilibrator 2 and then used to obtain the total volume pumped. Subsequently, all tubes were immersed in freezers for onward transport to the University of Texas at Austin, where they were analyzed by thermal desorption followed by gas chromatography with 4-bromofluorobenzene as an internal standard and electron mass spectroscopy. Subsequently, the composition and concentrations of VOCs were determined based on the base of volatile compounds of NISiT, as well as the mass of absorbed gases based on the reaction with an internal standard with a relative response factor of 1. Under these conditions, the relative response factor in the interval is usually approximately from 0.75 to 1.25 for the majority of possible BWOs, therefore, when determining the calculation errors, we took 25% as an approximation coefficient.
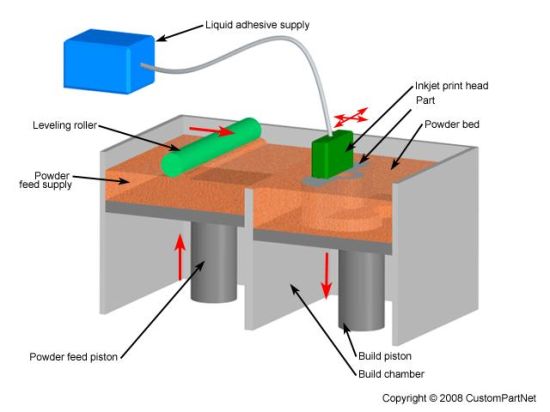 For some gases, this value may not exist, but this only indicates the correctness of the calculations of VOC concentrations. nine0003
We also measured VOC concentrations outside the fume hood during the entire printing process to ensure that no gases could escape into the fume hood. For this, adsorbent tubes were also used, but this time without connection to air pumps. Finally, we measured temperature and relative humidity, using the Onset HOBO U12, at 1-minute intervals, as well as the ventilation coefficient with carbon dioxide as the trace gas (described in more detail in the Reference Information) throughout all phases of the study. The last gas was vented from a small gas cylinder into a fume hood at the beginning of each sampling period, the concentrations of the gas already dispersed recorded by a PP Systems SA-5 carbon dioxide monitor paired with the previously mentioned Onset HOBO U12 also at 1 minute intervals. nine0003
2.3. Fixation of fine dust emissions
Due to significant scatter of fine dust concentrations, we initially decided to smooth the graphs of the obtained functions in the MATLAB 2015a software package (reflected in the Supplementary Material).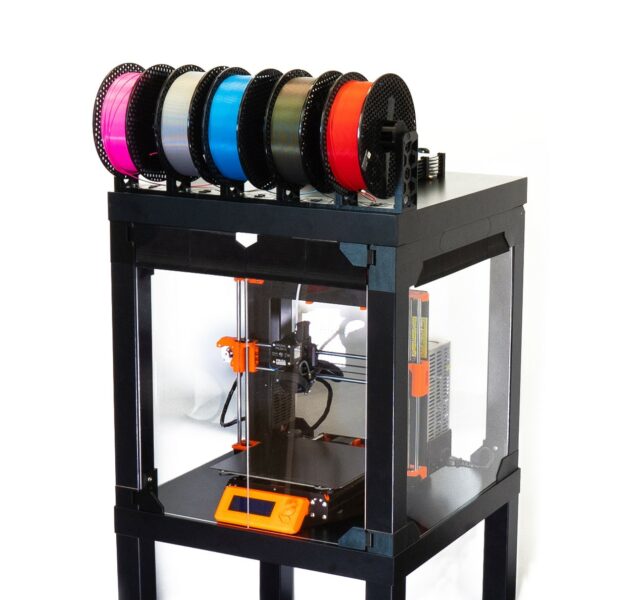 We subsequently used these smoothed functions to determine the time-based concentrations for each combination of printer and filament type in the mass balance equation for the total dust concentrations measured inside a chemical fume hood (shown in Equation 1 and Supplementary Material). nine0003
, where:
E UFP is the dependence of the concentration of fine dust from time to minute,
V - the volume of the exhaust cabinet M 3 ,
∆T - the time of the Shag of Measurements (interval in the interval of 1 minute),
L UFP - total concentration loss per minute,
C UFP,bg - average background concentrations of fine dust inside the fume hood before measurement,
L UFP - was taken as a logarithmic regression with the values of the first 60 minutes of the final stage after the completion of printing, which is also shown in the Reference Information. It should be noted that when compiling Equation 1, many assumptions were made that could lead to significant errors in determining the concentrations of fine dust, firstly, the dynamics of particle size and coagulation were ignored, and secondly, the loss of particle concentrations was assumed to be constant. The most potential impacts due to these assumptions have been detailed in the Background Paper. Also, we calculated the error in calculating the time dependence of concentrations - about 45% (reflected in the Reference Material). nine0003
Time-based fine dust concentrations were also used to calculate the total concentrations of fine dust emitted during the printing process per weight of filament used, as shown in Equation 2:
, where:
E particles emitted during printing based on the mass of used filament,
N - total number of time intervals (in minutes),
m object is the mass of the used filament (i. e. the mass of the printed model).
Notes for Table 1. a For all experiments except for one, we printed a model taken from NISiT resources. b Studies with repetition of VOC measurements. c Repeated measurements of fine dust. d Studies with additional measurements outside the fume hood. e Research with the replacement of the printed model from the NISiT resource base by ~195 cm 3 cube.
2.4. VOC concentrations
As a result of gas chromatography and electron mass spectroscopy, carried out in the period before the start of printing and the last ~45 minutes inside the fume hood, concentrations of up to fifty different VOCs were determined. Equation 3, by which the concentrations of all the indicated VOCs were determined, contains several assumptions. Firstly, ventilation was only a mechanism for removing the particles under study, secondly, the concentrations of the ten most concentrated emitted VOCs outside the fume hood were so insignificant (experimentally verified) that they were further neglected, thirdly, at the final stage of sampling VOC concentrations returned to background levels. More details about these assumptions can be found in the Reference Information. nine0003
, where:
E VOC,i is the constant emission rate (µg/min),
C VOC,i,print during the last ~45 minutes of printing (µg/m 3 ),
C VOC,i,bg — individual background VOC concentrations inside the fume hood before printing (µg/m3). We have calculated that the errors in these calculations are approximately 36%, as described in the Reference Information. nine0003
Total emissions of all ten most concentrated VOCs ( ΣVOC) were obtained by adding all individual VOC values inside the fume hood over the last ~45 minutes of printing. We decided to limit the number of the most concentrated gases to exactly ten, since the subsequent VOCs in the table make up a very insignificant fraction of the total concentration of gases ΣVOC i . In addition, the total discharge rate per gram of filament used in printing was also calculated, which is reflected in Equation 4:
, where:
E σvoc - total discharge speeds of the ten most concentrated gases,
ė σvoc - total discharge rate in the calculation of grams of used Philament.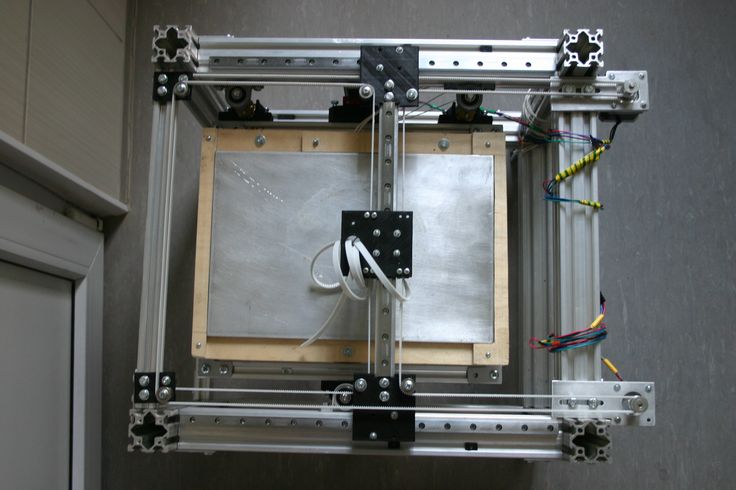
2.5. Description of printers and filaments used
We analyzed fine dust and VOC emissions data on sixteen different combinations of five popular home printers and nine different commonly used filaments. Among the first five models: FlashForge Creator with dual extruder, compatible with ABS and PLA (both plastics were used in research), Dremel 3D Idea Builder, only compatible with PLA, XYZprinting da Vinci 1.0, only compatible with ABS, MakerBot Replicator 2X, compatible only with ABS and LulzBot, in combination with the most common filaments ABS, PLA, HIPS, translucent nylon, Laybrick (imitation sandstone), Laywood (imitation wood composite), transparent polycarbonate, translucent thermoplastic nylon-based polyamide (PCTPE) and transparent polyester resin (T-Glase). Three of these printers, Dremel, XYZprinting, and MakerBot, are open type printers, while FlashForge and LulzBot are hermetically sealed. Of course, this list of printers is far from exhaustive, but it still allows you to cover a fairly large segment of today's most popular models of 3D printers, taking into account all sorts of existing distinguishing characteristics, such as the type of filament used, the temperature of the heated nozzle and print bed during printing, the presence or lack of additional structural elements. Table 1 summarizes all the experiments performed. nine0003
15 out of 16 combinations of printers and filament types were printed by NISiT test model, with the exception of one (LuilzBot-ABS) - a cube model. In addition, the MakerBot that printed ABS was also used twice: the first time when printing with an additional restrictive element provided by the manufacturer, and the second time without. We also presented individual data on VOC and fine dust emissions for these four combinations in order to assess the discrepancy between the data. nine0003
3. Results and conclusions
Figure 2. (a) The function of the obtained sample, as well as the smoothed function of fine dust concentrations and (b) time-based fine dust concentrations when printing LuizBot Mini 3D printer ABSOM3.1. Fine Dust Emissions
Figure 2a illustrates the graph of fine dust concentration over time when printing with LuizBot Mini ABS, as well as the sum function of fine dust concentrations. On the left image, the thick line shows the moment of warming up the printers before printing, which we also considered as one of the research stages.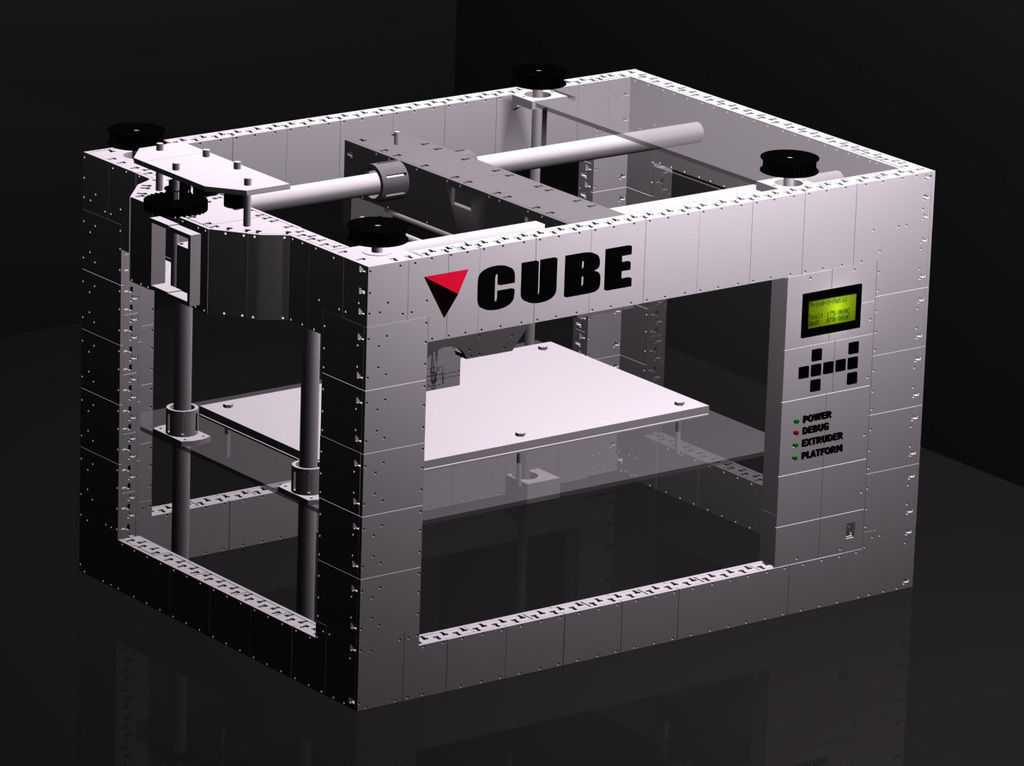 Figure 2b shows the time function of fine dust concentrations described by Equation 1. Pictures S6-S23 show similar time dependences of fine dust concentrations and dust levels for all sixteen combinations tested. nine0003
The results in Figure 2a almost coincide with most of the experiments, in which the concentrations of fine dust usually begin to rise rapidly immediately after the start of printing and persist for 10–20 minutes, immediately after which they fall to the bottom mark, not lower than the values of background concentrations. In several tests with other combinations of printers and filament types, fine dust concentrations again reached their peak around the end of the print period, due to the formation of ridges on the printed model. On the other hand, the dynamics of fine dust concentrations directly depends on the 3D printer model used, the type of filament, the geometry of the printed object, the temperature of the nozzle and the printing table, and the printing time.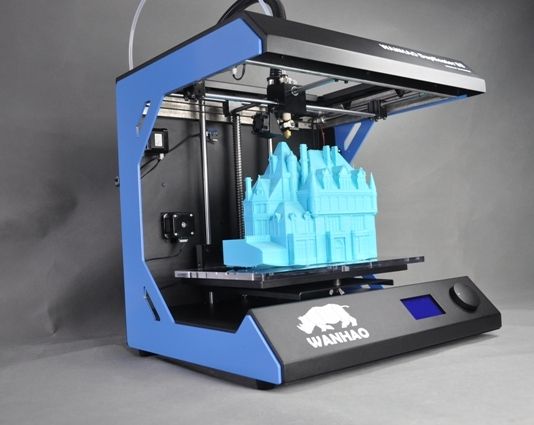 In the two scenarios considered (depicted in Figure 2a), fine dust concentrations approximately reach the equilibration level by the end of the printing period. We used data from these periods to verify the validity of the mass balance equation for fine dust concentrations described in the Reference Information for describing time-based experimental values of fine dust concentrations. The values obtained by both methods do not diverge during the described periods of research, on the basis of which it can be concluded that the dynamic mass equation for determining the concentrations of emissions is correct in this case. nine0003
Figure 3 illustrates the time dependence of fine dust concentrations for all sixteen combinations of printers and filaments, divided into groups: (I) ABS, (II) PLA, (III) other filaments.
Fine dust concentrations are highly dependent on operating conditions and 3D printer model, filament used, nozzle and platen print temperatures, and print time.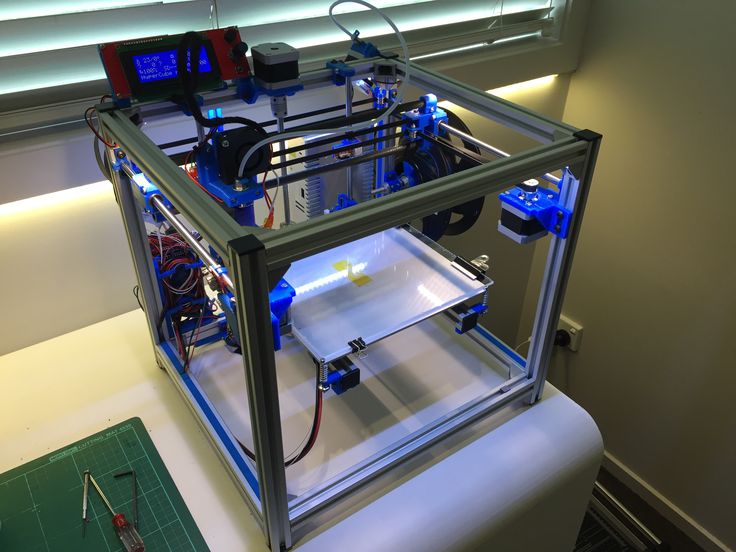 The highest concentrations occur when printing ABS plastics with average values ranging from ~2∙10 10 to 9∙10 10 h/min. among all ABS printers, regardless of the presence of additional designs. The lowest values occur with the three PLA based 3D printers due to factory specifications and 3D printer model, with average values being 10 8 h/min. This is noticeably lower than in our previous study, where there were slightly different experimental conditions, including a 3D printer model. Record average values of fine dust concentrations were recorded on the LuIzBot Mini printer when printing with polycarbonate (~4∙10 10 h/min), next in decreasing order PCTPE (~2∙10 10 h/min), T-Glase (~5∙10 9 h/min), HIPS ( ~4∙10 9 ppm), Nylon (~2∙10 8 ppm), Laywood (~8∙10 7 ppm) and Laybrick (~6 ∙10 7 h/min).
Replacement of the NISiT research model with the ABS cube model with LuIzBot plastic printer did not particularly affect the dynamics of fine dust concentrations and, accordingly, the curve function of concentrations versus time.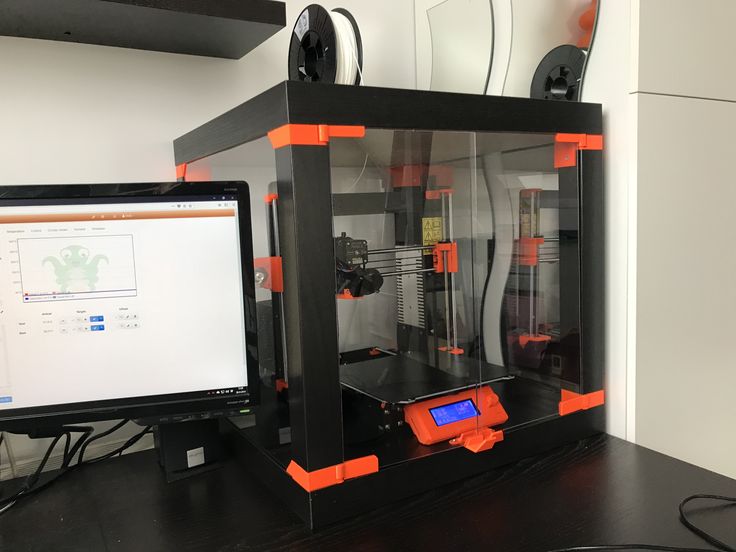 It is noteworthy that the presence of an additional design only slightly reduced the concentrations of fine dust when printing the MakerBot - ABS combination, the average values decreased by ~35% (also this discrepancy along with the error). Larger discrepancies were not considered, if only because the 3D printer was not hermetically sealed during the studies. During additional research data on how the geometry of the printed model and the lack of tightness can affect the concentrations of fine dust from the 3D model, no other definite conclusions are able to describe the presented data set. Finally, the data obtained during additional studies (Figure 6, 7, 17, 18) with and without structural elements also clearly demonstrate the significant influence of this factor: the average concentrations were 57% versus 48%, respectively. nine0003 Picture 3. Total concentrations of fine dust for 16 combinations of 3D printers and filament types. Each dot represents the data in one minute intervals, and the combination represents the entire print period (usually between 2.
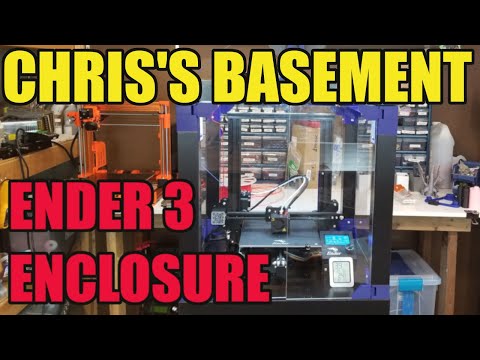 5 and 4 hours). Bold lines imply 25 and 75 percent values (50 percent median). The thin lines are the upper and lower adjacent values, the circles stand out sharply.
3.2. VOC concentrations
Figure 4 shows the concentrations of VOCs studied individually as well as in total, using data from 16 different combinations of printers and filament types used. Only the three gases with the highest concentrations were targeted for VOC concentrations in each test carried out, the remaining ten VOCs were listed as Remaining VOCs. The total value of these Remaining VOCs is characterized by ΣVOC . In addition, these ten VOCs with the highest concentrations during printing were compiled for all sixteen combinations inside the fume hood, as well as 4 additional studies (the results are shown in Table S2), Table S3 reflects the data outside the fume hood.
The choice of the type of filament affected the concentrations and nature of the emitted gases, while the change in the design features and model of the 3D printer had a greater impact on the total concentrations of emissions when using the same filament. Total concentrations ( E ΣVOC ) ranged from ~3 µg/min. for polycarbonate up to 200 µg/min. for the same nylon (both values are fixed when printed by LuIzBot). The three most concentrated gases accounted for up to 70% of the total emissions of VOC E ΣVOC in all studies. For most combinations of printers and filament types, these gases were in overwhelming quantities compared to the rest of the VOCs.
The most key gas among all VOCs released in all six combinations with ABS and only one with HIPS was styrene. The rate of release of this gas during printing with the specified filaments varied from ~12 to ~113 μg/min, depending on the model of the 3D printer used and its design features. It is noteworthy that both the lowest and highest concentrations were obtained when printing with a non-hermetically sealed design (XYZprinting and MakerBot). Both the concentrations of styrene separately and the total concentration values obtained in this case turned out to be somewhat less than when printing with the combination LuIzBot - ABS of the cube model compared to the NISiT model, however, it is noticeably higher than when printing with the MakerBot - ABS combination with additional structural elements, in contrast to the data, printed without them.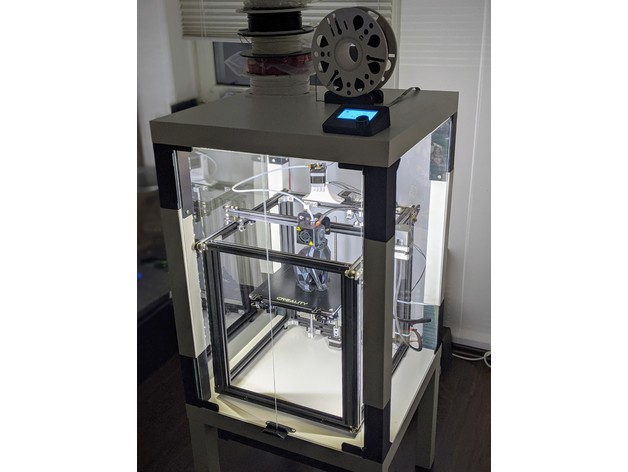 nine0003
First of all, among all the VOCs released when printing with nylon, PCTPE, Laybrick and Laywood, caprolactam should be highlighted. All plastics were used in conjunction with a LuIzBot 3D printer. All of the listed filaments during the printing process became serious sources of VOCs (shown in Figure 4b), among which the highest release rate for caprolactam reaches 180 µg/min. when printed with nylon. Caprolactam was also released during the printing process with polycarbonate and T-Glase filaments on the LuIzBot, although in much smaller quantities (Figure 4a). Finally, lactide (3,6-dimethyl-1,4-dioxane-2,5-dione) turned out to be the most concentrated gas released during PLA printing, albeit in relatively lower concentrations - from 4 to 5 µg/min. when printed with three different models of PLA 3D printers. We are convinced of the strong dependence of the spectrum of VOCs emitted on the type of filament used for most of the tests carried out and even for tests where printing adhesive was used.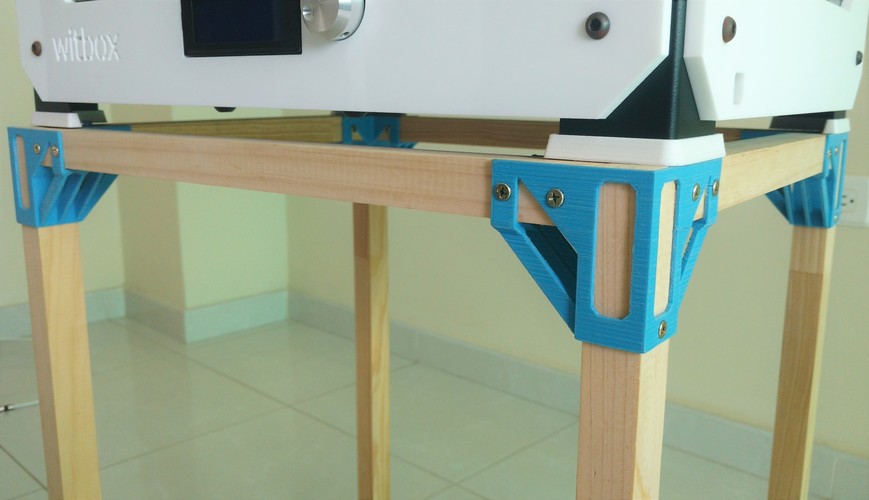 Since the main derivatives of the latter were also measured separately (propylene glycol and glycerol, as shown in Table S2), only one combination was found (shown in Figure 4). nine0003 Picture 4. Emission values for the three most concentrated VOCs, or less, that is, the remaining ten gases when printed in sixteen different combinations. For visual clarity, the data are divided into two groups: (a) weak sources with a release rate of up to 40 µg/min. and (b) strong - more than 40 µg/min. When compiling the tables, errors were not taken into account, for each gas it amounted to ~36%, which is reflected in the Reference Information.
3.3. Nozzle and Platen Heat Effect
In the next step, we examined the data on fine emissions and total VOC emissions as a function of nozzle and platen temperature (Figure 5). The data were divided into three groups according to the temperature of the printing bed: less than 45 ֯С, in the range of 60–65 ֯С and in the range of 100–110 ֯С, a graph was also built depending on the temperature of the nozzle (in the range of 190–270 ֯С, as illustrated in Table 1).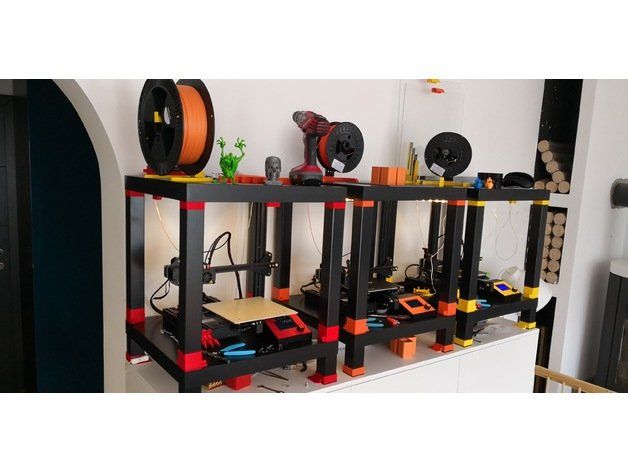
An increase in nozzle temperature had almost no effect on the concentrations of fine dust released during printing in the study of the data of the first and last groups. However, the opposite result was observed at medium table temperatures, when a significant increase in fine dust concentrations was recorded. In a separate study, the change in the temperature of the printing bed (without changing the temperature of the nozzle) showed a significant increase in the concentrations of fine dust. Most combinations of 3D printers and filaments in the upper temperature range had large concentrations of fine dust, while lower concentrations were observed in the lower temperature range. On the other hand, no relationship was found between total VOC concentrations and changes in platen or nozzle temperatures. The study of other combinations of 3D printers and types of filament may give a different result, but here we are talking about a small sample. nine0003 Picture 5. Influence of printing temperatures of the nozzle and printing table on the concentrations of fine dust and VOC.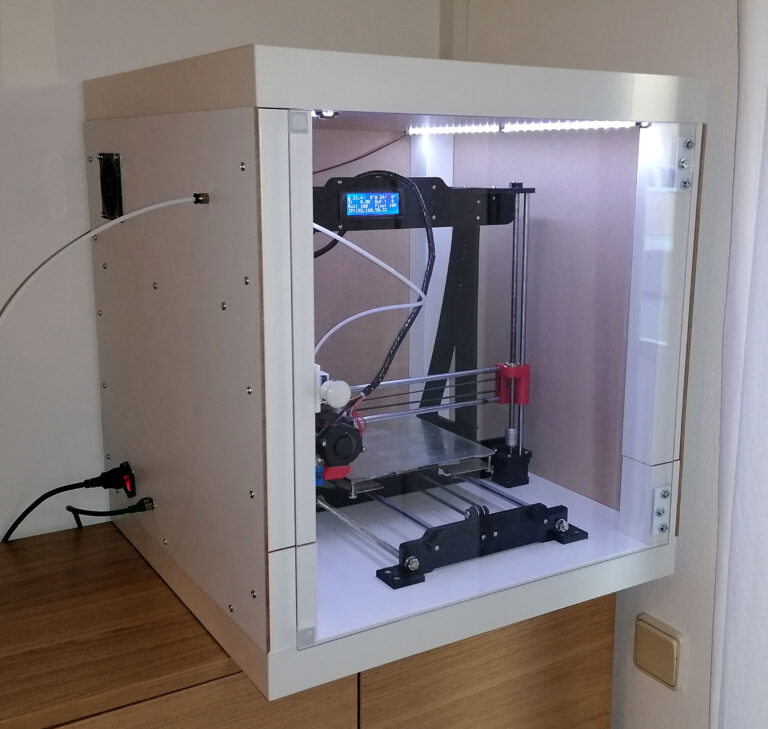
3.4. Dependences between the total concentrations of fine dust VOC per unit mass of filament
Figure 6 illustrates the data of the total concentrations of fine dust (reflected in Equation 2) and VOC (reflected in Equation 4) per unit mass of filament during printing for all sixteen combinations of 3D printers and types of filament.
The total concentrations of fine dust per unit mass of the filament vary in the range from ~2∙10 8 U/g with LuizBot - Laybrick combination up to ~2∙10 11 for most ABS printers. The total concentrations of VOCs per unit mass of filament range from ~6 µg/g for the LuizBot-polycarbonate combination to 800 µg/g for nylon printing with the same 3D printer model. Moreover, when printing with ABS, PCTPE and HIPS filaments, the highest values for the total concentrations per unit mass of both fine dust and VOC appeared, while when printing with PLA plastic, there were relatively low values for both the first and second concentrations.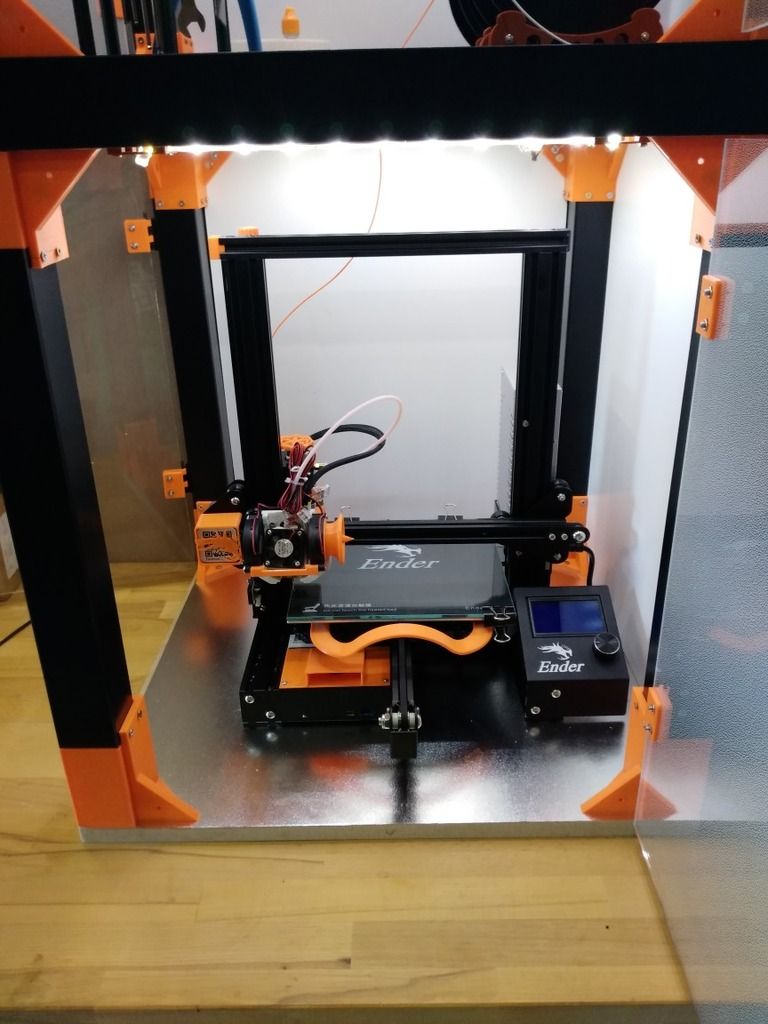 It is also noteworthy that printing with both T-Glase and polycarbonate (both filaments were used in conjunction with LuizBot) gave low VOC emissions, but high fine dust emissions. In contrast, printing with Laywood and Laybrick filaments (also used in conjunction with LuizBot) gave high VOC releases, but low fine dust releases. Similar results should probably also not be extended to other combinations of 3D printers and filament types not considered in these studies. nine0003 Picture 6. Fine dust concentrations per gram of filament
3.5. Effects of human exposure to printing products
Published data on concentrations of fine dust and individual VOCs carry considerable weight in the study of the effects of products released during the printing process on the human body. For example, styrene, according to the International Agency for Research on Cancer (IRCA), is a carcinogen (IRCA group 2B), turned out to be the most concentrated VOC in 3D printing by all types of ABS and one type of HIPS.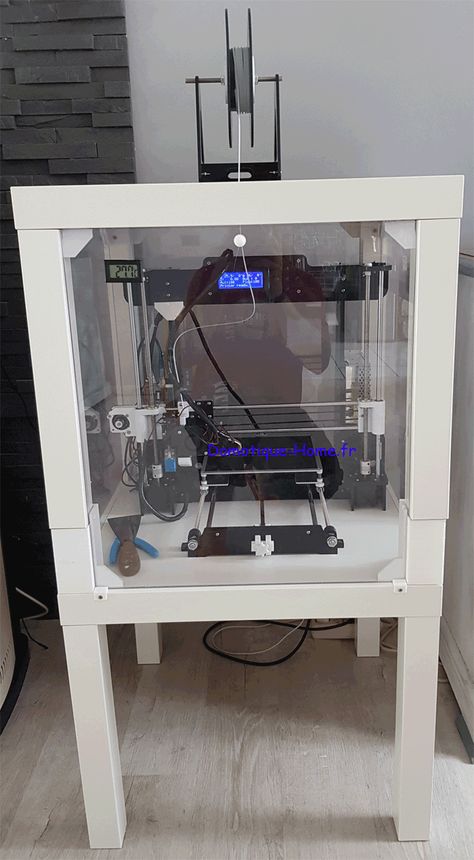 Caprolactam, also detected in large quantities when printed with nylon, PCTPE, Laybrick, and Laywood, is not considered a human carcinogen, however, the California Environmental Hazards Authority defines the gas as a source of acute, sustained (over eight hours) irritation at extreme permissible concentrations 50.7 μg / m 3 and 2.2 µg/m 3 single and daily, respectively. For polylactide resin vapors, the most concentrated gas among all products emitted during 3D printing of PLA with plastic, there was no information confirming its harmfulness.
In order to draw a more or less clear line when analyzing the allowable concentrations, as well as the possible potential harm caused by volatile products in the process of 3D printing in a small enclosed space, in the study we used data from the conducted experiments on the concentrations of fine dust and VOCs. Of course, our attempt cannot be called a complete detailing of the impact of a whole range of harmful substances released during the printing process, rather, it is a preliminary review of the most concentrated volatile substances that have an impact on the human body.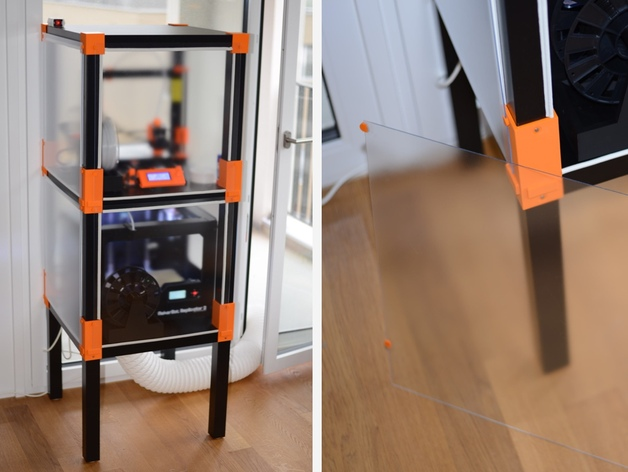 It is also worth taking into account the errors in obtaining these concentrations, which may have led to an overestimation of the concentrations of fine dust and VOC under various experimental conditions. nine0003
In this study, the 3D printer ran smoothly in a well-ventilated 45 m 3 office space (i.e., the same office used in previous studies by Steffens et al., with fine dust concentrations of ~10 11 h/min and 183 µg/min for caprolactam, 113 µg/min for styrene and 5 µg/min for lactide, assuming an air mass mixing level of 1 h -1 without any loss for of the three listed gases (probably a conservative estimate), as well as the rate of fine dust settling in 1.3 h. -1 ). Taking these assumptions into account, the background concentrations for all studied steel components are respectively ~58000 cm -3 for fine dust, ~244 μg/m 3 - for caprolactam, ~150 μg/m 3 - for styrene and ~6 μg /m 3 - for lactide.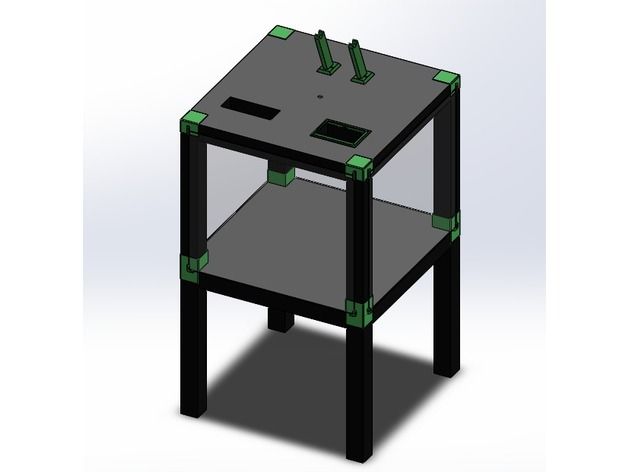
The reported concentrations of caprolactam (244 µg/m 3 ) exceed all three acceptable limits, according to the California Research Center, even with significant errors (caused by the previously listed assumptions) when printing with nylon and other nylon-containing plastics, which is fraught with unpleasant consequences for health (in particular, for people with reduced immunity). It should be noted that exceeding the norms of caprolactam concentration can cause irritation of the mucous membranes of the eyes and respiratory tract, and can also adversely affect the nervous system (according to the Center for Disease Control and Prevention). nine0003
Calculated concentrations of styrene (~150 µg/m 3 ) under the same conditions are approximately twenty times higher than background concentrations in office buildings (according to studies conducted by the Environmental Protection Agency) and more than twenty times greater than average concentrations in the home environment. There are also articles reporting that such an excess of styrene concentrations is fraught with poor health. For example, high levels of styrene can increase the risk of cancer (considered in one study as one of the natural factors in the development of cancer), and is also a major source of lung disease in infants (i.e., exceeding as little as 2 µg/m 3 ).
We are not aware of maximum allowable fine dust limits, however note that concentrations of ~58000 cm -3 would be approximately ten times the background dust concentrations in an office building, laboratories and schools. Also, these values are slightly higher than average dust concentrations in houses. However, this is still less than in other similar environments.
Given all the data given, we can make certain recommendations. First, it is necessary to supplement the presented data on fine dust concentrations and individual gas concentrations for their more accurate assessment, studies should take into account the proximity effect.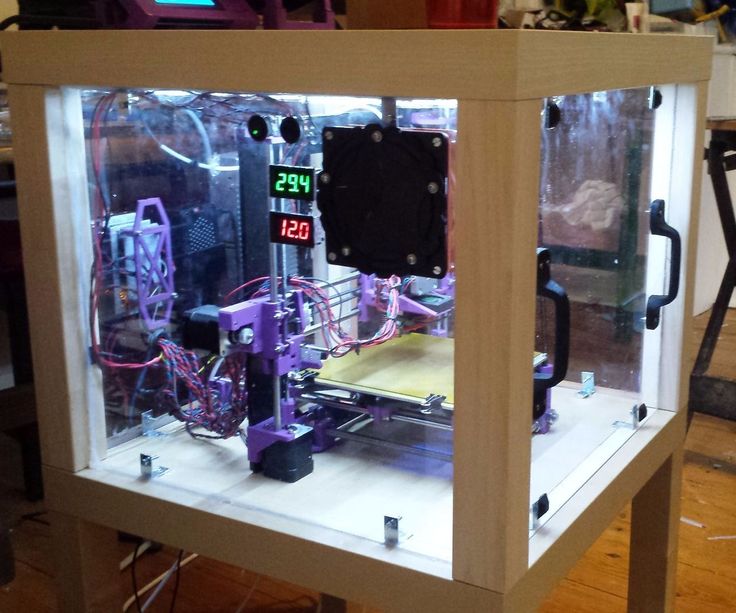
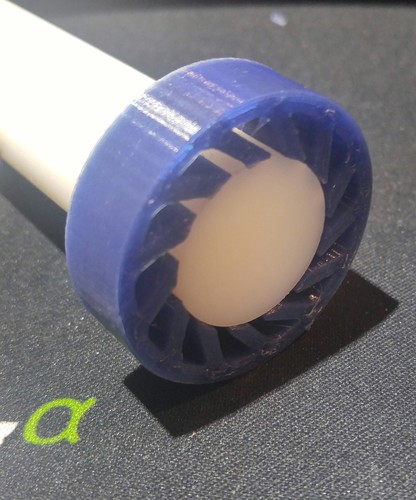
_Angle_View.jpg)